- During the fiscal year ended 30 September 2021 (“FY21”), Frasers Property (“FPL”) reported SGD 3,763.8m in revenue which is a 4.6% year-on-year (“YoY”) increase from SGD 3,597.0m in FY20.
- Profit before interest, fair value change, taxation and exceptional items (“PBIT”) for FY21 was SGD 1,424.7m, a 14.4% increase YoY.
- FPL has SGD 3.78b of cash and bank deposits as of FY21 and more than SGD 3b of unused credit lines for their funding needs. Total borrowings was SGD 17.28b, of which SGD 4.85b are short term borrowings.
- We think the probability of a non-call for its 3.95% perps has reduced due to the group’s improving refinancing ability.
Interest rate hikes are set to kick start in 2022 as the US Federal Reserve leaned towards earlier rate hikes from their recent FOMC meeting in December 2021. What does this mean for investors and are there opportunities that can be found in this rising interest rate environment?
Frasers Property Limited is shifting its focus to Industrial & Logistics (“I&L”) assets and has a strong pipeline for 2022. Their perpetual notes are one of the highest yielding notes in the SGD real estate space and we will take a look into the notes and their credit profile.
About Frasers Property
Frasers Property Limited is a multinational real estate developer that is headquartered in Singapore. The company is listed on the SGX-ST Main Board and has total assets of approximately SGD 40.3b as at 30 September 2021.
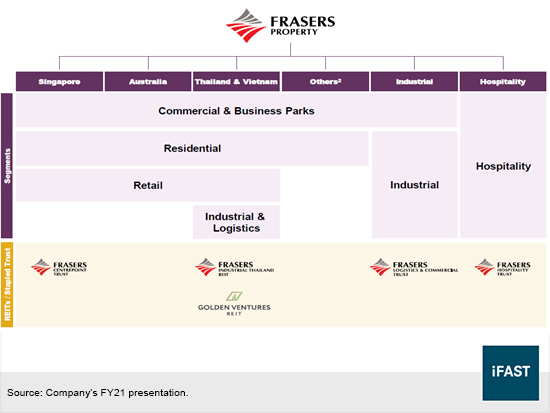
FPL has 6 Strategic Business Units comprising (1) Singapore, (2) Australia, (3) Hospitality, (4) Industrial & Logistics, (5) Thailand & Vietnam and (6) Others. The company operates across 5 real estate asset classes – residential, retail, commercial & business parks, industrial & logistics, and hospitality. FPL has a large geographical reach with properties located in Southeast Asia, Australia, Europe and China. On top of that, FPL operates its hospitality business in over 20 countries.
The company is also the sponsor of two REITs and one stapled trust listed on the SGX-ST. Frasers Centrepoint Trust is focused on retail while the Frasers Logistics and Commercial Trust is focused on industrial and commercial properties. Frasers Hospitality Trust is a stapled trust comprising of Frasers Hospitality REIT and Frasers Hospitality Business Trust and is focused on hospitality properties.
Figure 1: FPL group structure
FY21 Financial Results
During the fiscal year ended 30 September 2021 (“FY21”), FPL reported SGD 3,763.8m in revenue which represents a 4.6% year-on-year (“YoY”) increase from SGD 3,597.0m in FY20. Profit before interest, fair value change, taxation and exceptional items (“PBIT”) for FY21 was SGD 1,424.7m, up 14.4% from a year ago. Results were however boosted by higher contributions from I&L properties due to the recognition of gains from the reclassification of some I&L properties that were held for sale. If we exclude the one-time gain on the reclassification, PBIT for FY21 would be SGD 1,069m which is a 14.2% decrease YoY.
From Table 1, we see that PBIT largely fell for most business segments except for Australia and Hospitality. The fall in PBIT for Singapore, Thailand & Vietnam and Others were due to reduced level of residential settlements and lower profit recognition from residential developments. As mentioned above, PBIT for the Industrial segment has been boosted by the one-time gain from the reclassification of I&L properties while Australia saw a gain of 58.7% due to higher level of residential settlements.
Table 1: FPL’s FY21 PBIT by business segment (in SGD m)
|
Business Segment |
FY21 |
FY20 |
Change |
|
Singapore |
SGD 270.7m |
SGD 312.7m |
(13.4%) |
|
Australia |
SGD 60.8m |
SGD 38.3m |
58.7% |
|
Industrial |
SGD 829.5m |
SGD 351.1m |
136.6% |
|
Hospitality |
SGD 4.4m |
SGD 19.6m |
(77.6%) |
|
Thailand & Vietnam |
SGD 196.7m |
SGD 265.4m |
(25.9%) |
|
Others (China and UK) |
SGD 117.0 |
SGD 319.5 |
(63.4%) |
|
Corporate and others |
(SGD 54.4m) |
(SGD61.0m) |
(10.8%) |
| Source: Company’s FY21 presentation. | |||
Growth of industrial assets
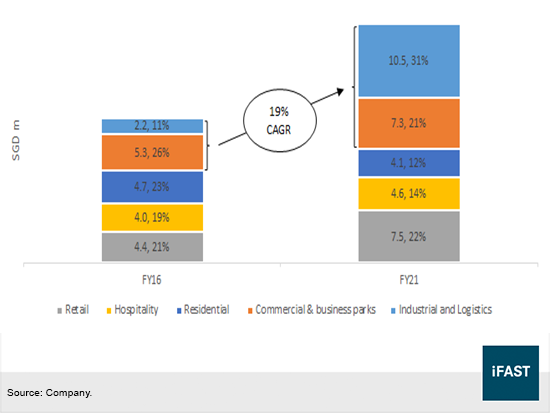
Within the last 5 years, FPL has been making a large effort to shift towards I&L and commercial and business parks exposure in its properties. As seen from Figure 2, in FY16, I&L, commercial and business parks made up 37% (SGD 7.5b) of its total property assets and grew at 19% CAGR (compound annual growth rate) to 52% (SGD 17.8b) in FY21.
Figure 2: Total property assets
In FY21, FPL completed 8 assets (6 in Australia and 2 in Europe) totalling SGD 406m in Gross Development Value (“GDV”). Looking ahead, FPL is currently developing 11 projects totalling to SGD 751m in GDV (9 in Australia and 2 in Europe) and they are expected to be completed in FY22 and FY23.
The shift to industrial assets is due to the strong demand for these spaces underpinned by the growth in e-commerce. Rental growth is expected to pick up due to strong demand and limited supply for logistics and industrial spaces.
Strong earnings visibility and pipeline
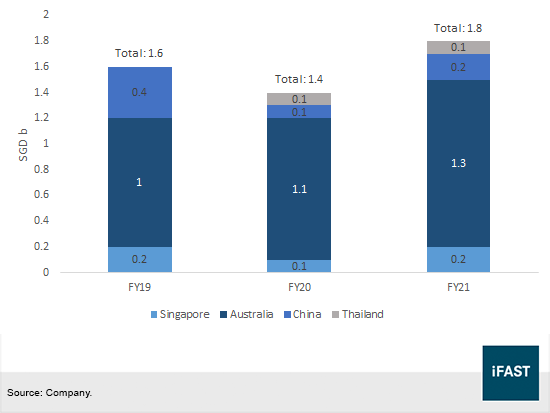
FPL has a strong pipeline of development projects and this provides earnings visibility and revenue recognition from the completion of these projects. As of 30 September 2021, FPL has 30 development projects expected to be completed in FY22.
Additionally, FPL has SGD 1.8b of unrecognised revenue which will provide earnings and cashflow visibility going forward. Table 4 in the appendix lists all the development projects in FPL’s pipeline to be completed in 2022.
Figure 3: Total unrecognised revenue
Additionally, 68% of FPL’s FY21 PBIT was recurring income which provides stable and consistent cashflows to the company. As mentioned previously, a portfolio of industrial properties was reclassified from properties held for sale to investment properties. This was part of the group’s strategic initiative to grow its industrial and logistics asset base. FPL has no intention to sell these properties but instead hold them for capital appreciation. These assets are being leased to third parties for rental income.
Liquidity and credit profile
FPL has SGD 3.78b of cash and bank deposits as of FY21. Additionally it has more than SGD 3b of unused credit lines for their funding needs. Total borrowings was SGD 17.3b of which SGD 4.85b are short term borrowings. FPL may use its unused credit lines to refinance its short term borrowings. The balance of the gross proceeds from their 2021 rights issue was SGD 900.1m, which will provide liquidity to pay down its short term debts.
FPL has taken steps to reduce their gearing as seen from Figure 4, net debt to equity fell from 105.0% in 4Q20 to 73.7% in 4Q21. The management said that the company is comfortable with net gearing at a range between 80% and 100%.
Figure 4: FPL’s net debt to equity
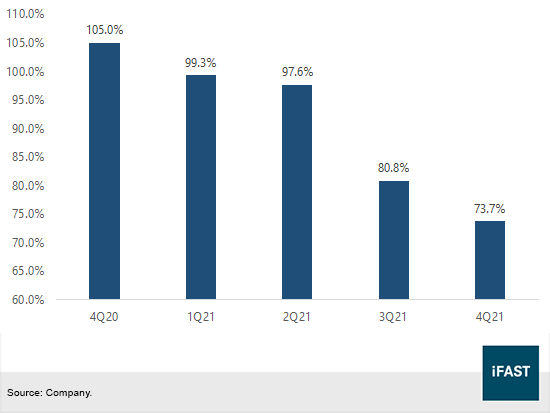
Table 2: Estimated credit ratios of comparable property developers
|
As of Jun 2021 |
Net debt/ |
Net debt/ |
Interest coverage ratio (x) |
|
Frasers Property Ltd |
73.68 |
33.55 |
4.0 |
|
GuocoLand Ltd |
90.00 |
45.20 |
~1.94 |
|
City Developments Ltd |
98.56 |
37.19 |
2.5 |
|
UOL Group Ltd |
28.75 |
19.83 |
12.0 |
|
OUE Ltd |
39.91 |
25.91 |
2.1 |
| Source: Company filings, Bloomberg Finance L.P. estimates, iFAST estimates. As of 30 June 2021. | |||
From Table 2, FPL has a high gearing ratio when compared to other comparable property developers. This could be due to the large amount of development in its pipeline. Interest coverage ratio is adequate at 4.0x, signifying earnings will be able to cover its financing costs.
Relative Valuation
At first glance, the FPLSP 3.950% Perpetual Corp (SGD) looks very attractive at its yield to next call (“YTC”) of 7.70% with about 10 months to its call date on 5 October 2022. If FPL does not call the notes, the 3.950% perps will reset at the prevailing SGD 5Y SOR + 2.245%.
With the US Federal Reserve looking to start hiking rates in 2022, this may push the 5Y SOR up, causing the reset rate to be more than its current coupon rate, increasing the likelihood that its financing cost will be more than its current coupon rate if the notes are not redeemed on its call date on 5 October 2022. As at 6 January 2022, the 5Y SOR was 1.6% and at current prices, the reset reference rate is at 3.845%, just 10 basis points below its current coupon rate of 3.95%.
Additionally, FPL may use its cash and banking lines to refinance short term debt to repay existing short term debt.
Another point to note is that the group had previously called back perps whose reset rates are lower than their coupon rate. Frasers Hospitality Trust called the FHREIT 4.450% Perpetual Corp (SGD) on their call date on 12 May 2021. The 4.450% perps could have reset at 3.475% (5Y SOR on 12 May 2021 was 1.025%). However, the issue size for the 4.450% perps was much lower at SGD 100m as compared to SGD 350m for the 3.95% perps.
Figure 5: Relative valuation among other real estate perpetual notes
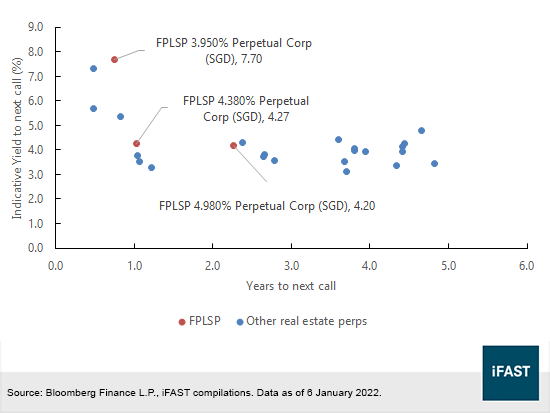
The FPLSP 4.380% Perpetual Corp (SGD) has a YTC of 4.27% (callable on 17 Jan 2023) and will reset on 17 January 2028. It will reset at the SGD 10Y SOR + initial spread of 2.180% + step-Up margin of 100bps. The FPLSP 4.38% Perpetual Corp (SGD) and FPLSP 4.980% Perpetual Corp (SGD) have yields-to-worst (“YTW”) of 4.27% and 4.20% respectively, although we cannot rule out price fluctuations due to higher interest rates.
In terms of fixed rate notes, most of FPL issues are of longer maturities as seen from Table 3. Investors who invest in these bonds should be aware of interest rate risks and should be prepared to hold them until maturity.
Table 3: FPL fixed rate notes
|
Issuer name |
Coupon (%) |
Maturity |
Ask Price |
Ask Yield to Maturity (%) |
|
Frasers Property AHL Ltd |
3 |
10/9/2028 |
98.461 |
3.255187 |
|
Frasers Property Treasury Pte Ltd |
4.15 |
2/23/2027 |
104.631 |
3.162625 |
|
Frasers Property Treasury Pte Ltd |
4.25 |
4/21/2026 |
105.208 |
2.944068 |
|
Frasers Property Treasury Pte Ltd |
3.65 |
5/22/2022 |
101.103 |
0.567656 |
| Source: Bloomberg Finance L.P., iFAST compilations. Data as of 7 January 2022. | ||||
Conclusion
We think that the 3.950% perps provide the highest yield along the FPLSP curve as the perps have a short call date of approximately 10 months to the next call date. The FPLSP 3.950% Perpetual Corp (SGD) is attractively priced as the issuer has a strong credit profile with about SGD 3b in cash and about SGD 3b in unused credit lines. At the 5Y SOR last price, the 5Y SOR was 1.6%, making it likely that the reset rate will be higher than the current coupon of 3.95%, if the notes are not called in October 2022. Investors who do not mind holding bonds until maturity may consider the fixed rate notes but should be aware of rising interest rate risks.
Appendix
Table 4: FPL’s pipeline of development projects to be completed in FY22
|
Development Project |
Development type |
Country |
% of units sold |
Gross development value (SGD m) |
Estimated total saleable area (‘000 sqm) |
Target completion date |
|
Westmeadows (Valley Park) |
Residential / Mixed used |
Australia |
99.5 |
95.6 |
n/a |
1Q FY22 |
|
Point Cook (Life, Point Cook) |
Residential / Mixed used |
Australia |
99.8 |
212.3 |
n/a |
2Q FY22 |
|
Carina (Minnippi Quarter) |
Residential / Mixed used |
Australia |
99.0 |
120.2 |
n/a |
3Q FY22 |
|
Horsley Park (Eastern Creek Quarter, Stage 2) |
Retail |
Australia |
- |
- |
11.3 |
3Q FY22 |
|
Dandenong South (Spec) |
Industrial |
Australia |
- |
- |
22.6 |
4Q FY22 |
|
Tarneit (Spec) |
Industrial |
Australia |
- |
- |
27.9 |
3Q FY22 |
|
Braeside (IVE Group) |
Industrial |
Australia |
- |
- |
30.8 |
2Q FY22 |
|
Epping, (Crusader Caravans/Intel Engineering & Spec) |
Industrial |
Australia |
- |
- |
37.7 |
2Q FY22 |
|
Richlands (Spec) |
Industrial |
Australia |
- |
- |
12.2 |
4Q FY22 |
|
Yatala (Spec) |
Industrial |
Australia |
- |
- |
18.0 |
2Q FY22 |
|
Tarneit (HB Commerce) |
Industrial |
Australia |
- |
- |
70.0 |
4Q FY22 |
|
Macquarie Exchange –MQX4 (AscendasREIT) |
Industrial |
Australia |
- |
- |
19.4 |
4Q FY22 |
|
Roermond, Netherlands |
Industrial |
Europe |
- |
- |
33.3 |
1Q FY22 |
|
Breda Hazeldonk, Netherlands |
Industrial |
Europe |
- |
- |
11.4 |
1Q FY22 |
|
Two Grande Monaco Bangna-Wongwaen |
Residential |
Thailand |
76.6 |
79.8 |
41.8 |
1Q FY22 |
|
Golden City Chaengwattana-Muang Thong |
Residential |
Thailand |
59.9 |
31.5 |
14.1 |
2Q FY22 |
|
Golden City Sathorn |
Residential |
Thailand |
52.1 |
30.1 |
10.6 |
3Q FY22 |
|
Golden Town 2 Bangkae |
Residential |
Thailand |
53.2 |
45.6 |
22.8 |
4Q FY22 |
|
Golden Town Sathorn |
Residential |
Thailand |
72.4 |
70.7 |
29.6 |
4Q FY22 |
|
Golden Town Sriracha-Assumption |
Residential |
Thailand |
74.2 |
45.8 |
38.9 |
4Q FY22 |
|
Golden Neo 2 Bangkae |
Residential |
Thailand |
50.0 |
47.0 |
26.7 |
4Q FY22 |
|
Alpina |
Residential |
Thailand |
63.4 |
165.2 |
87.3 |
4Q FY22 |
|
Silom Edge –Bangkok CBD |
Commercial and retail |
Thailand |
- |
- |
21 |
4Q FY22 |
|
Bangna2 Logistics Park, Bangpakong Chachoengsao |
Industrial and Logistics |
Thailand |
- |
- |
22 |
1Q FY22 |
|
Bangkok Logistics Park, Puchaosamingprai Samutprakarn |
Industrial and Logistics |
Thailand |
- |
- |
40 |
2Q FY22 |
|
Frasers Property Logistics Center, Bangplee 7 Samutprakarn |
Industrial and Logistics |
Thailand |
- |
- |
42 |
2Q FY22 |
|
Amata City Rayong Industrial Estate, Rayong |
Industrial and Logistics |
Thailand |
- |
- |
7 |
3Q FY22 |
|
Opus One4, Xuhui, Shanghai |
Residential |
China |
98.6 |
- |
39 |
1Q FY22 |
|
Gemdale Megacity (Phase 6), Songjiang, Shanghai |
Residential |
China |
90.9 |
- |
25 |
2Q FY22 |
| Source: Company FY21 annual report, iFAST compilations. | ||||||
Declaration: For specific disclosure, at the time of publication of this report, IFPL (via its connected and associated entities) holds a position in FPLSP 4.980% Perpetual Corp (SGD) and the analyst who produced this report holds a NIL position in the abovementioned securities.
Our podcast series, Yield Hunters, is available on Spotify, iTunes Podcasts and Google Podcasts. We share our thoughts on new bond issues and hold discussions on the fixed income space. Listen to our latest episode below and follow us!